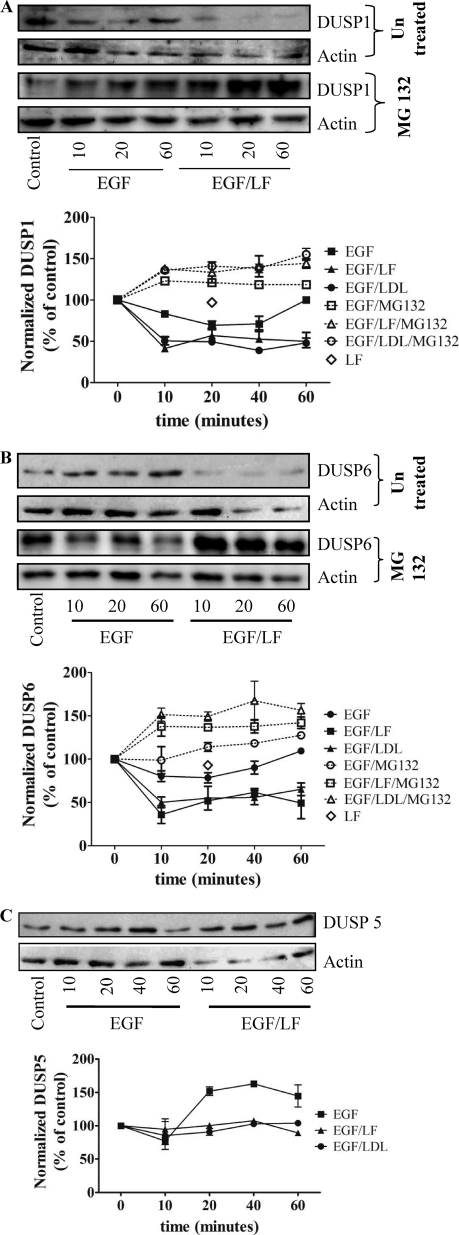
FIGURE 7.
Changes in the levels of DUSP1 (A), DUSP6 (B), and DUSP5 (C) in cells stimulated by the combined addition of EGF and lactoferrin. Serum-starved HT1080 cells were pretreated with vehicle or MG132 (10 μm) for 30 min and subsequently stimulated with EGF (25 ng/ml) and lactoferrin (70 μg/ml) or LDL (100 μg/ml) for the indicated time periods. Expression of DUSP1 (A), DUSP6 (B), and DUSP5 (C) was assessed from immunoblots, quantified densitometrically, and normalized to actin. The blots shown are representative of three independent experiments; relative levels (initial control = 100%) are shown in the graphs (error bars, S.E.).

