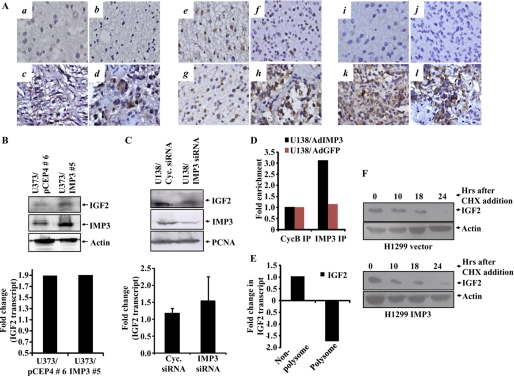
FIGURE 5.
IMP3 exerts its proproliferative effects through the translational activation of IGF-2 mRNA. A, immunohistochemical of staining for IGF-2 for section from DA (a), 3/9 (33.3%) positive for staining; AA, 2/10 (20%) positive for staining (b); secondary GBM (c) and primary GBM (d), positive for staining (29/50; 58.00%). Including four normal brain samples (all four negative), ANOVA for difference in their IGF-2 positivity was carried out (p = 0.0239). Immunohistochemical staining for AKT expression for a section from DA (e), all cases positive for staining (9/9); AA, all cases positive for staining (10/10) (f); secondary GBM (g), and primary GBM (h), (30/34; 88.20%) positive for staining. Including four normal brain samples (all cases positive) ANOVA for difference in their Akt positivity was carried out (p = 0.4139). Immunohistochemical staining for phospho Akt for section from DA, 1/9 (11.1%) positive for staining (i); AA, 2/10 (20%) cases positive for staining (j); secondary GBM (k) and primary GBM (l), 23/34 (67.60%) positive for staining. Including four normal brain samples (all four negative), ANOVA for difference in their pAkt positivity was carried out. p = 0.0008). B, equal amounts of lysates for the vector and IMP3 overexpressing stable clones of U373 were subjected to Western blotting to detect the levels of IMP3 (anti-IMP3, Sigma), IGF-2 (anti-IGF-2, Santa Cruz Biotechnology), and actin (anti-actin HRP, Sigma). Fold change in the IGF-2 transcript levels obtained from RT-qPCR analysis in the IMP3-overexpressing and vector-stable clones relative to the control cells is depicted below. There is a significant increase in the IGF-2 protein levels upon IMP3 overexpression without a change in the IGF-2 transcript levels (compare lane 2 with 1). C, equal amounts of total protein lysates from cyclophilin (Cyc.) and IMP3 siRNA-transfected U138 cells at 120 h after transfection were subjected to Western blotting to detect levels of IGF-2 (anti-IGF-2, Abcam), IMP3 (anti-IMP3, Sigma), and proliferating cell nuclear antigen (anti-proliferating cell nuclear antigen, oncogene) proteins. The bottom panel shows the fold change in the IGF-2 transcript levels obtained from RT-qPCR analysis of the siRNA transfected U138 cells at 120 h. There is a significant decrease in the IGF-2 protein levels upon IMP3 knockdown without a change in the IGF-2 transcript levels (compare lane 2 with lane 1). D, fold change in the real-time RT-qPCR-based quantitation of the IGF-2 transcript levels in the IMP3 and control antibody immunoprecipitates is plotted. LN229 cells were infected with a control adenovirus and an Ad-IMP3 adenovirus and IMP3 and the control antibody immunoprecipitates were used to analyze for the IGF-2 transcript levels. E, U138 cells were transfected with IMP3 or cyclophilin siRNA, and 4 days after siRNA transfection, the cell lysates were made and subjected to polysomal fractionation. Relative fold change in the IGF-2 transcript levels between cyclophilin and IMP3 siRNA-transfected cells within polysome or non-polysome fractions are shown. F, H1299 vector and IMP3-stable cells were treated with 50 μg/ml cycloheximide (CHX) for 10, 18, and 24 h. Equal amounts of lysates were subjected to Western blotting to detect the levels of IGF-2 and actin.

