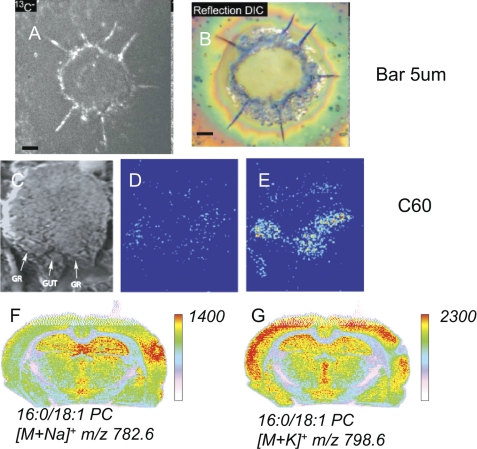
FIGURE 3.
Imaging of lipids using MS. A, SIMS imaging of fatty acid transport in cultured adipocytes after unwashed 3T3F442A adipocytes were incubated with [13C]oleate. Images are of 13C−. Scale bar = 5 μm. This figure has been reprinted with permission as open access from Ref. 38. B, optical image using a reflection differential interference contrast microscope of the same cells before analysis with SIMS. Reflection differential interference contrast (DIC) images (magnification ×500) were obtained using a Nikon Eclipse E800 upright microscope. Scale bar = 5 μm. This figure has been reprinted with permission as open access from Ref. 38. C, scanning ion image of an axial slice from a 9-day-old mouse embryo. The gut and genital ridge (GR) are identified by white arrows. D and E, SIMS images of cholesterol (m/z 366–370) from the tissue in the SIMS image. The image in E was taken before a sputter dose of 1 × 10¹³ C60+60+/cm2, and the image in C was taken after nanotome sputtering. This figure has been reprinted with permission from Elsevier (39). F and G, rat brain sections from a traumatic brain injury model and imaging by MALDI-IMS corresponding to 16:0/18:1 PC ([M + Na]+, m/z 782.6) and 16:0/18:1 PC ([M + K]+, m/z 798.6), respectively (51).

