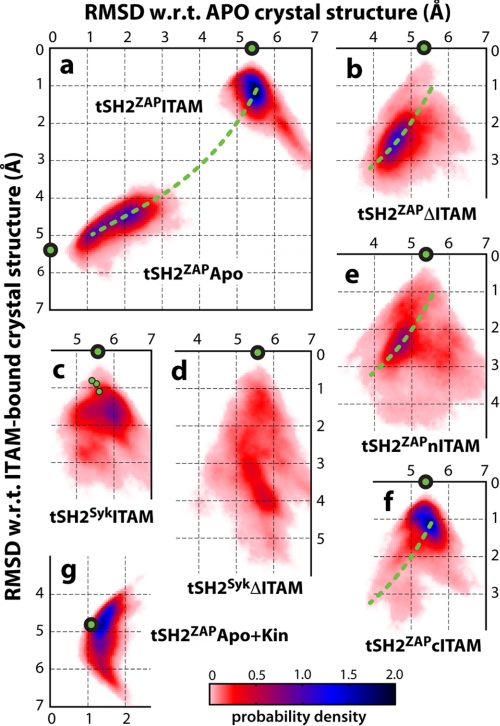
FIGURE 4.
Structural dynamics of the SH2 tandem in different constructs. The conformational variability of the tandem is represented as a probability density in two dimensions, namely the r.m.s.d. relative to the apo (x axis) or ITAM-bound (y axis) structures determined by crystallography. The location of the actual crystal structures in this representation is indicated by green circles as follows: ITAM-bound ZAP-70 (9) in a, b, e, and f; ITAM-bound Syk (10) in c and d; apo ZAP-70 (6) in a; and kinase-bound ZAP-70 (11) in g. In panel c, additional experimental structures of the corresponding SH2 tandem from the same crystal are indicated. Green dashed lines indicate the approximate direction of motion between apo and ITAM-bound states of ZAP-70, as observed in the simulations of the tSH2ZAPApo (a) and tSH2ZAPΔITAM (b) constructs. Correlation coefficients between selected probability density distributions from this figure are shown in Table 1. w.r.t., with respect to.

