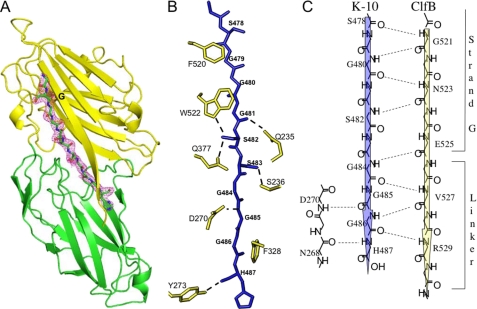
FIGURE 2.
Crystal structure of the ClfBN2N3·K10 peptide complex. A, ribbon representation of the ClfB·K10 peptide complex. The peptide is shown in stick format and is colored by atom type: carbon, green; nitrogen, blue; and oxygen, red. 2Fo − Fc electron density map around the peptide contoured at 1σ is shown in purple. B, representation of the key side-chain interactions of ClfB and the K10 peptide. The K10 peptide is shown in blue stick format. Side-chain atoms of interacting residues in ClfB are shown in yellow. Hydrogen bonds are shown as dotted lines. C, schematic representation of the backbone hydrogen bonding interactions between ClfB and the K10 peptide. Hydrogen bonds are shown as dotted lines. The K10 peptide makes a parallel β-sheet complementation with ClfB.

