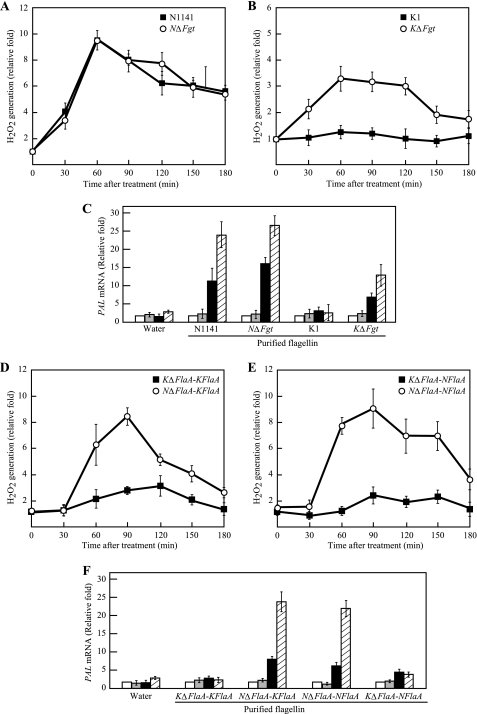
FIGURE 4.
Induction of immune responses in cultured rice cells by flagellins purified from N1141 wild-type, N1141 ΔFgt, K1 wild-type, and K1 ΔFgt strains of A. avenae. A, time course of H2O2 generation in cultured rice cells that were treated with flagellin purified from the N1141 wild-type (solid squares) or N1141 ΔFgt (open circles) strain. B, time course of H2O2 generation in cultured rice cells that were treated with flagellin purified from the K1 wild-type strain (solid squares) or K1 ΔFgt (open circles) strain. H2O2 was detected using a luminol chemiluminescence assay. C, PAL mRNA levels in cultured rice cells that were treated with flagellins purified from the N1141 wild-type, N1141 ΔFgt, K1 wild-type, and K1 ΔFgt strains of A. avenae. The mRNA levels were calculated from the threshold point located in the log-linear range of RT-PCR. Standard samples with known template amounts were used to quantitate the PAL mRNA levels. The y axis represents the -fold change relative to the PAL mRNA levels of water-treated cultured rice cells. White columns, 0 h after treatment; gray columns, 1 h after treatment; black columns, 3 h after treatment; hatched columns, 6 h after treatment. D, time course of H2O2 generation in cultured rice cells that were treated with K1-type flagellin purified from the KΔFlaA-KFlaA (KΔFlaA strain carrying the K1 FlaA expression vector) (solid squares) or NΔFlaA-KFlaA (NΔFlaA strain carrying the K1 FlaA expression vector) (open circles) strain. E, time course of H2O2 generation in cultured rice cells that were treated with N1141-type flagellins purified from the KΔFlaA-NFlaA (KΔFlaA strain carrying the N1141 FlaA expression vector) (solid squares) or NΔFlaA-NFlaA (NΔFlaA strain carrying the N1141 FlaA expression vector) (open circles) strain. F, PAL mRNA levels in cultured rice cells that were treated with flagellins purified from the KΔFlaA-KFlaA, NΔFlaA-KFlaA, NΔFlaA-NFlaA, and KΔFlaA-NFlaA strains of A. avenae. The mRNA levels were calculated from the threshold point located in the log-linear range of RT-PCR. Standard samples with known template amounts were used to quantitate the PAL mRNA levels. The y axis represents the -fold change relative to the PAL mRNA levels of water-treated cultured rice cells. White columns, 0 h after treatment; gray columns, 1 h after treatment; black columns, 3 h after treatment; hatched columns, 6 h after treatment. The error bars in all figures indicate the S.D. for five experiments.

