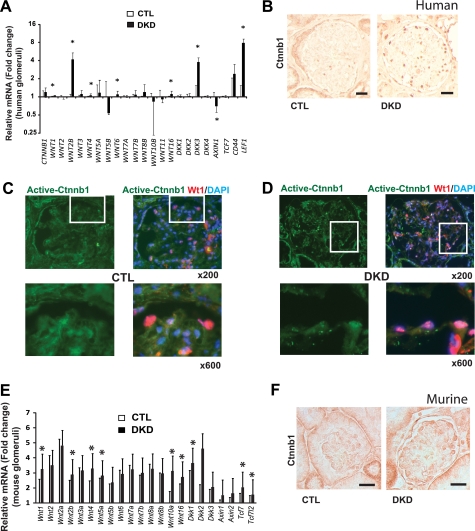
FIGURE 1.
Increased podocyte Wnt/Ctnnb1 signaling in patients and mice with diabetic kidney disease. A, relative mRNA levels in control (CTL) and DKD. The y axis is the logarithmic scale of fold change values as compared with the average of control groups, and the data represent means ± S.D. *, p < 0.05. B, immunostainings for total Ctnnb1 of human healthy (CTL) and DKD glomeruli. Scale bar, 40 μm. C and D, immunofluorescent co-stainings of active Ctnnb1 (green) and podocyte marker Wt1 (red) in control and DKD of human kidney samples with DAPI (blue) nuclear counterstaining. E, gene expression changes in isolated glomeruli of control (CTL) and STZ-treated diabetic kidneys (DKD, black bars). The y axis is the fold change values as compared with the average of control groups, and the data represent means ± S.D. *, p < 0.05. F, immunostaining for total Ctnnb1 in control and diabetic mouse kidney samples. Scale bar, 20 μm.

