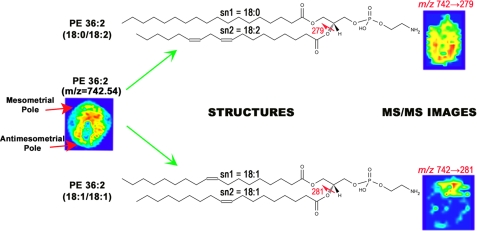
FIGURE 4.
MS/MS lipid imaging. MS imaging of m/z 742.54 shows a ubiquitous pattern from top to bottom of the implantation site. However, MS/MS imaging of this ion shows that it is made up of two distinct isobaric structures that have very different localization patterns. PE (36:2; 18:0/18:2) is localized to the antimesometrial pole (lower), whereas PE (36:2; 18:1/18:1) is localized to the mesometrial pole (upper).

