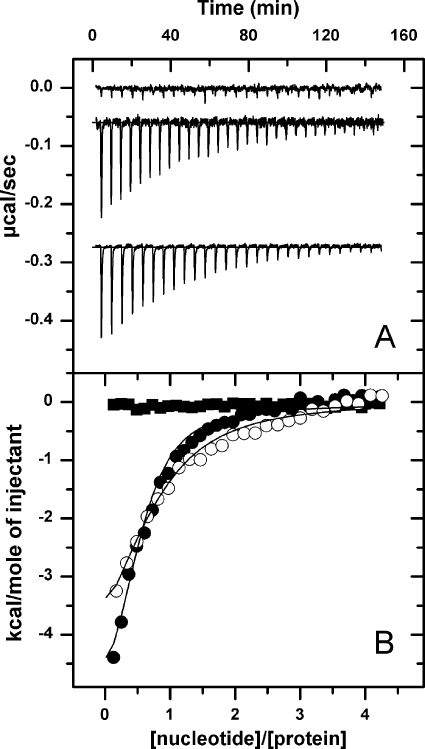
FIGURE 2.
The affinity of NBD2 for nucleotides is higher than that of NBD1. A, shown is the base-line-corrected instrumental response of successive injections of ATP into a solution of T1N2 (upper trace), N1T2 (middle trace), and T1T2 (bottom trace) at 25 °C. 8 μl of 350 μm ATP were injected into the calorimetric cell containing 10 μm (T1T2, T1N2) or 12 μm (N1T2) protein monomer. Experiments were performed in 50 mm Tris-HCl, pH 7.5, 150 mm KCl, and 20 mm MgCl2. Titrations were shifted for better viewing. B, integrated data of T1N2 (black squares), N1T2 (white circles), and T1T2 (black circles) titration with ATP and fit of the corresponding binding isotherms to a single-site binding model (solid lines).

