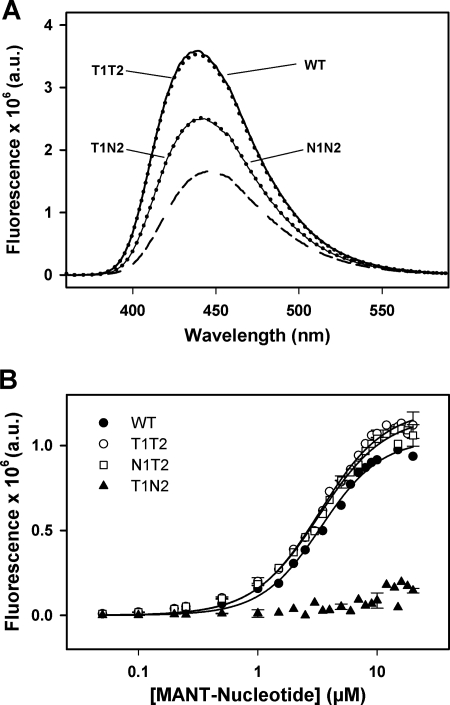
FIGURE 3.
Binding of fluorescent nucleotide analogs to different ClpB variants. A, emission spectra of MANT-ADP in the absence (short dashed line) or presence of different ClpB variants (WT, T1T2, T1N2, and N1N2) are shown. Nucleotide and protein concentrations were 10 μm and 20 μm, respectively. Experiments were carried out in 50 mm Tris-HCl, pH 7.5, 20 mm MgCl2, 50 mm KCl, pH 7.5. B, titrations of WT ClpB and protein variants (10 μm) with MANT-ADP or MANT-ATP in the buffer described above are shown. The intensity values obtained with mutant N1N2, coming from nonspecific interaction between the protein and the corresponding fluorescent-nucleotide analog, were subtracted from the values obtained with the other protein variants. Data are the means ± S.D. (n = 2). a.u., arbitrary units.

