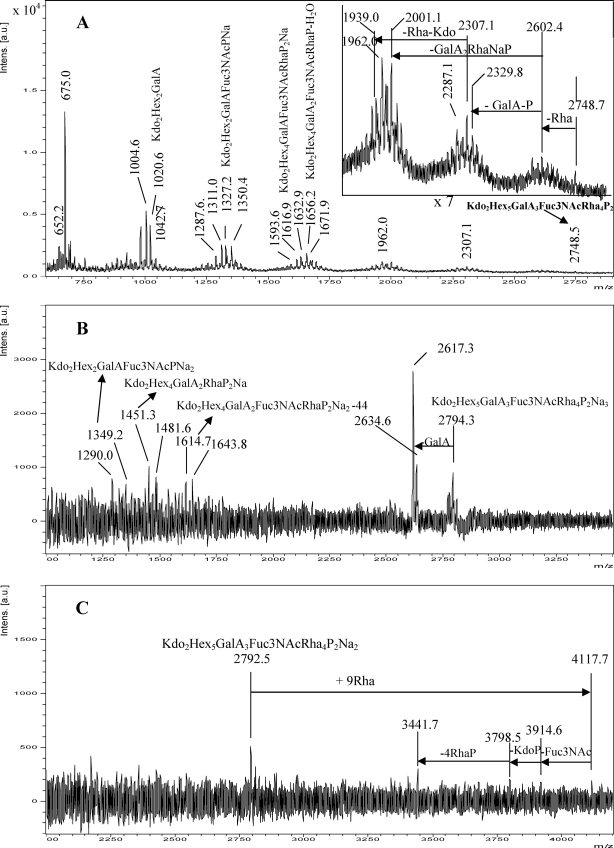
FIGURE 4.
UV-MALDI-TOF MS analysis of the oligosaccharides released from Xac LPSs. A, spectrum obtained from the Xacwzt LPS analyzed in the negative ion mode. The upper inset shows in detail the high mass region of the spectrum. Spectra were obtained from the Xacwzt LPS in positive ion mode (B) and from Xac LPS in the positive ion mode (C). Schematic structures of the most representative ions are shown. The mass numbers given are those of monoisotopic peaks. For the assignment of the structures, see Scheme 1 and “Results.”

