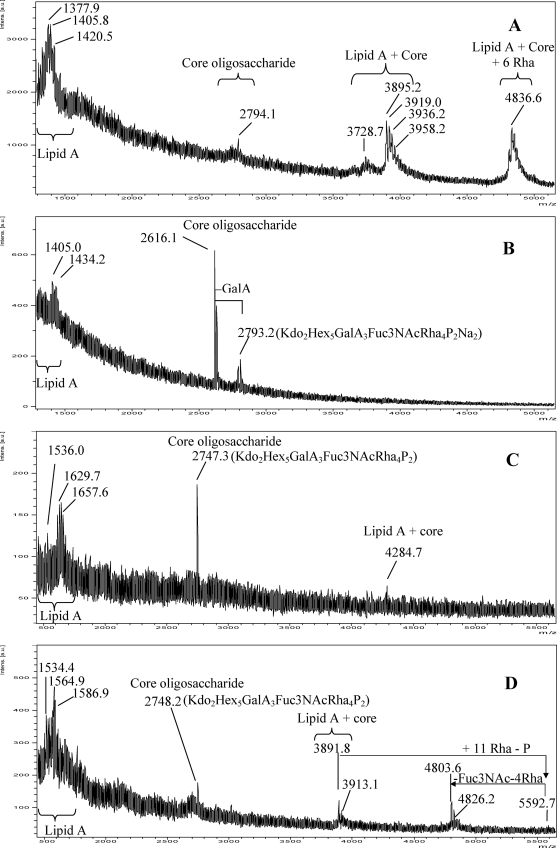
FIGURE 5.
UV-MALDI-TOF MS analysis of the LPSs isolated from Xac. Xac wild type LPS in the positive ion mode (A), Xacwzt LPS in the positive ion mode (B), Xacwzt LPS in the negative ion mode (C), and Xac wild type LPS in the negative ion mode (D) spectra are shown. The mass numbers given are those of monoisotopic peaks. Main regions corresponding to the lipid A moiety, core, core + lipid A, and lipid A + core + O-antigen are indicated. Schematic structures of the most representative ions are shown. For the assignment of the structures, see Fig. 9B and “Results.”

