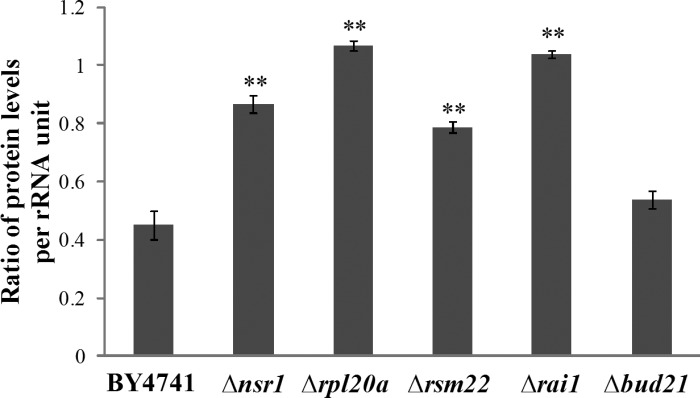
Fig. 7.
The ratio of total protein levels per rRNA unit in hypoxic cells to those in normoxic cells. Cell extracts containing proteins and ribosomes were prepared from the indicated hypoxic and normoxic cells. Extracts containing 800 μg of proteins were fractionated by using 7–50% sucrose gradient as described in materials and methods. Fractions containing ribosomes were pooled. The rRNA levels were detected by measuring A260. The rRNA levels in the fractions should reflect the amounts of ribosomes. Ribosome efficiency in hypoxic cells compared with normoxic cells was estimated by dividing the total protein levels per rRNA unit in hypoxic parent or mutant cells with those in the corresponding normoxic cells. Welch 2-sample t-tests were performed to compare hypoxic with normoxic wild-type or mutant cells. The P values were calculated by using the R program. **P values of < 0.001.

