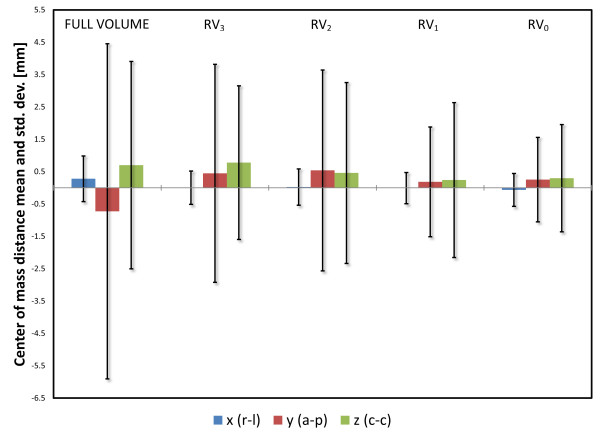
Figure 2.
Registration results. Center of mass standard deviations per coordinate, grouped by registration volume. The colored bar represents the mean center of mass distance and the error bars displays ± 1 standard deviation. The variance in center of mass distance is stable for the right-left direction, but increases with increasing registration volume size for the other directions.

