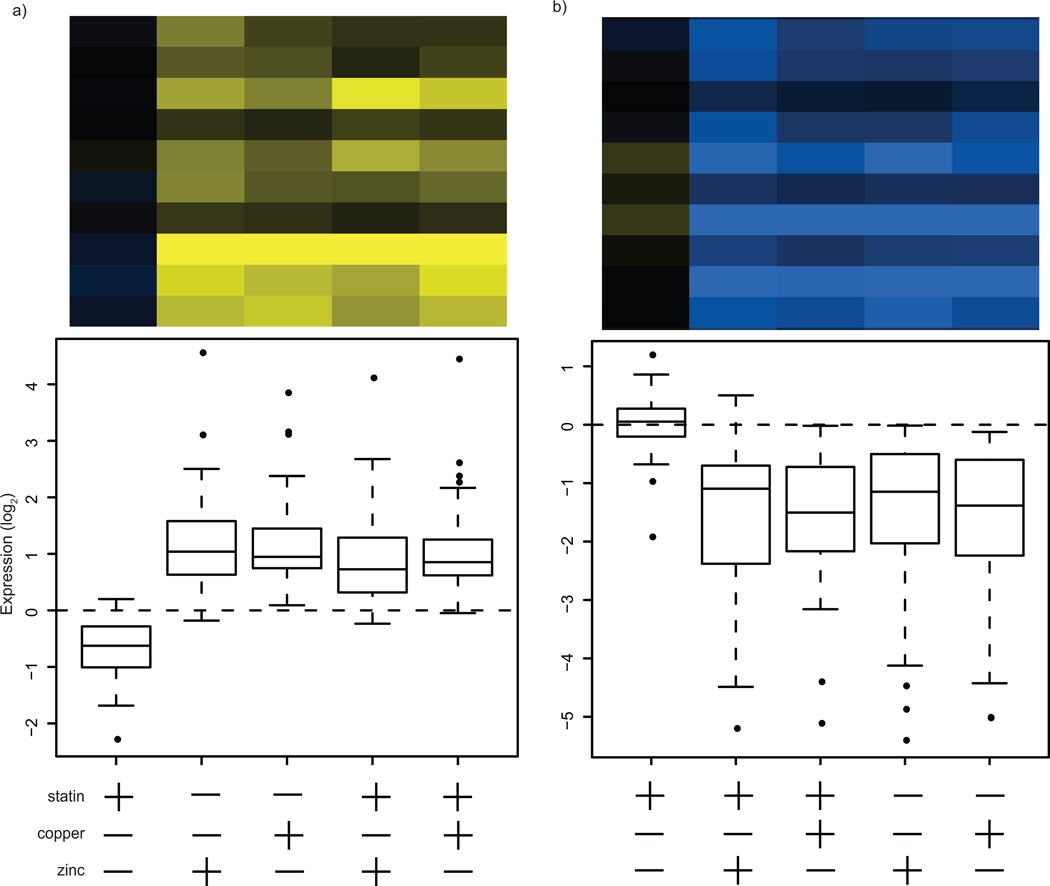
Figure 3.
Gene expression clusters primarily responsive to metal treatment. Measurement of gene expression following treatment of yeast cultures with statin, zinc/copper or both resulted in clusters of genes with particular expression patterns. Each panel represents a cluster and contains a representative clustergram as well as a plot of the mean expression level for treatment conditions relative to untreated cultures. (a) Metal responsive (MR) cluster #1 contains genes that are primarily upregulated in response to metal. (b) Metal responsive (MR) cluster #2 contains genes that are primarily upregulated in response to metal. The scale shown is log2.

