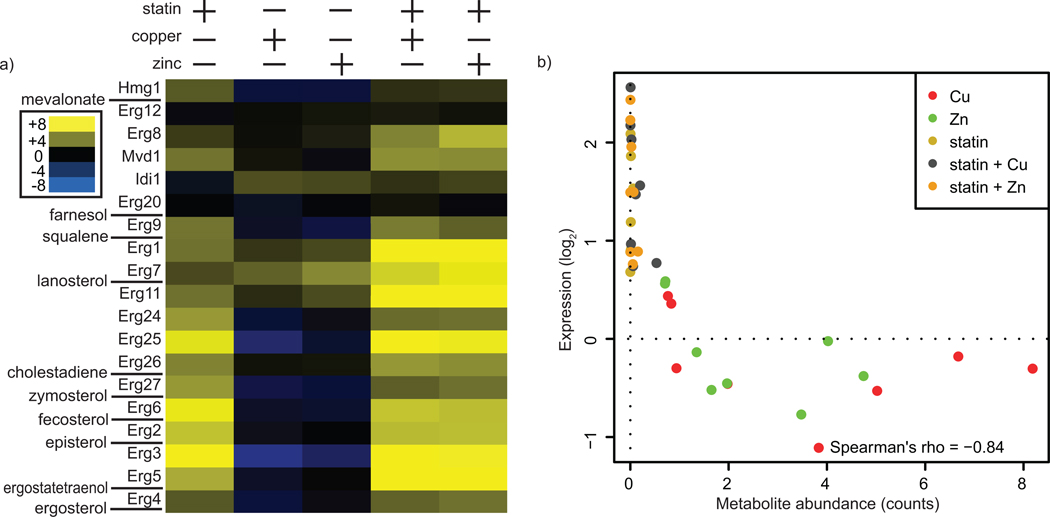
Figure 5.
Ergosterol metabolites and biosynthetic gene expression levels are correlated. (a) Expression data for each gene in the ergosterol biosynthetic pathway is shown, in descending order. Ergosterol intermediates measured in this study (see Figure 2) are indicated. The scale shown is log2. (b) Intermediate levels are plotted against the expression level of the gene immediately downstream of each intermediate (i.e. the protein for which the intermediate is a substrate). For each condition, pathway intermediate and expression data were normalized to the untreated condition.

