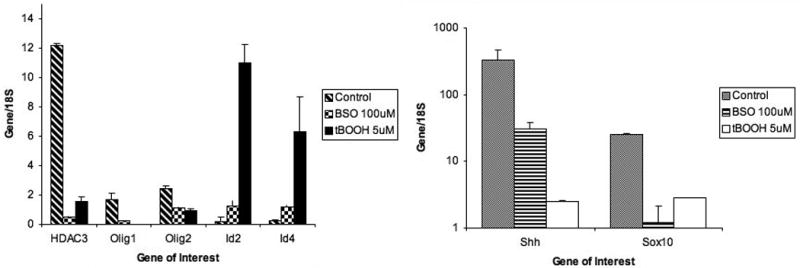
Figure 2.

Expression of genes promoting or inhibiting differentiation of oligodendrocyte precursor cells. The graph shows significantly decreased expression of Shh, Sox10, HDAC3, Olig1 and Olig2 72 hours after exposure to oxidants compared to control and significantly increased expression of Id2 and Id4 after exposure to oxidants. cDNA expression from 3 separate experiments, each performed in triplicate, was averaged. The data are presented as the mean ± standard deviation. *P < 0.05 vs. control.
