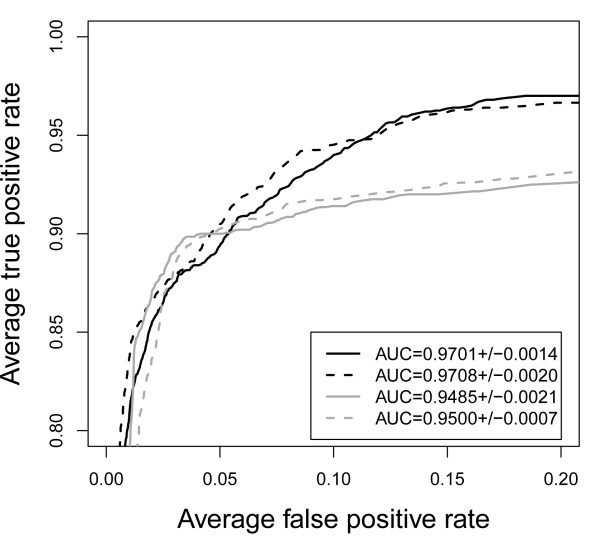
Figure 2.
Example: ROC curves. Comparison of prediction performance based on different descriptors and interpolation methods implemented in Interpol and visualized with ROCR [14]. black: hydropathy (descriptor = 151); grey: net charge (descriptor = 146); solid line: linear interpolation; dashed line: spline interpolation.

