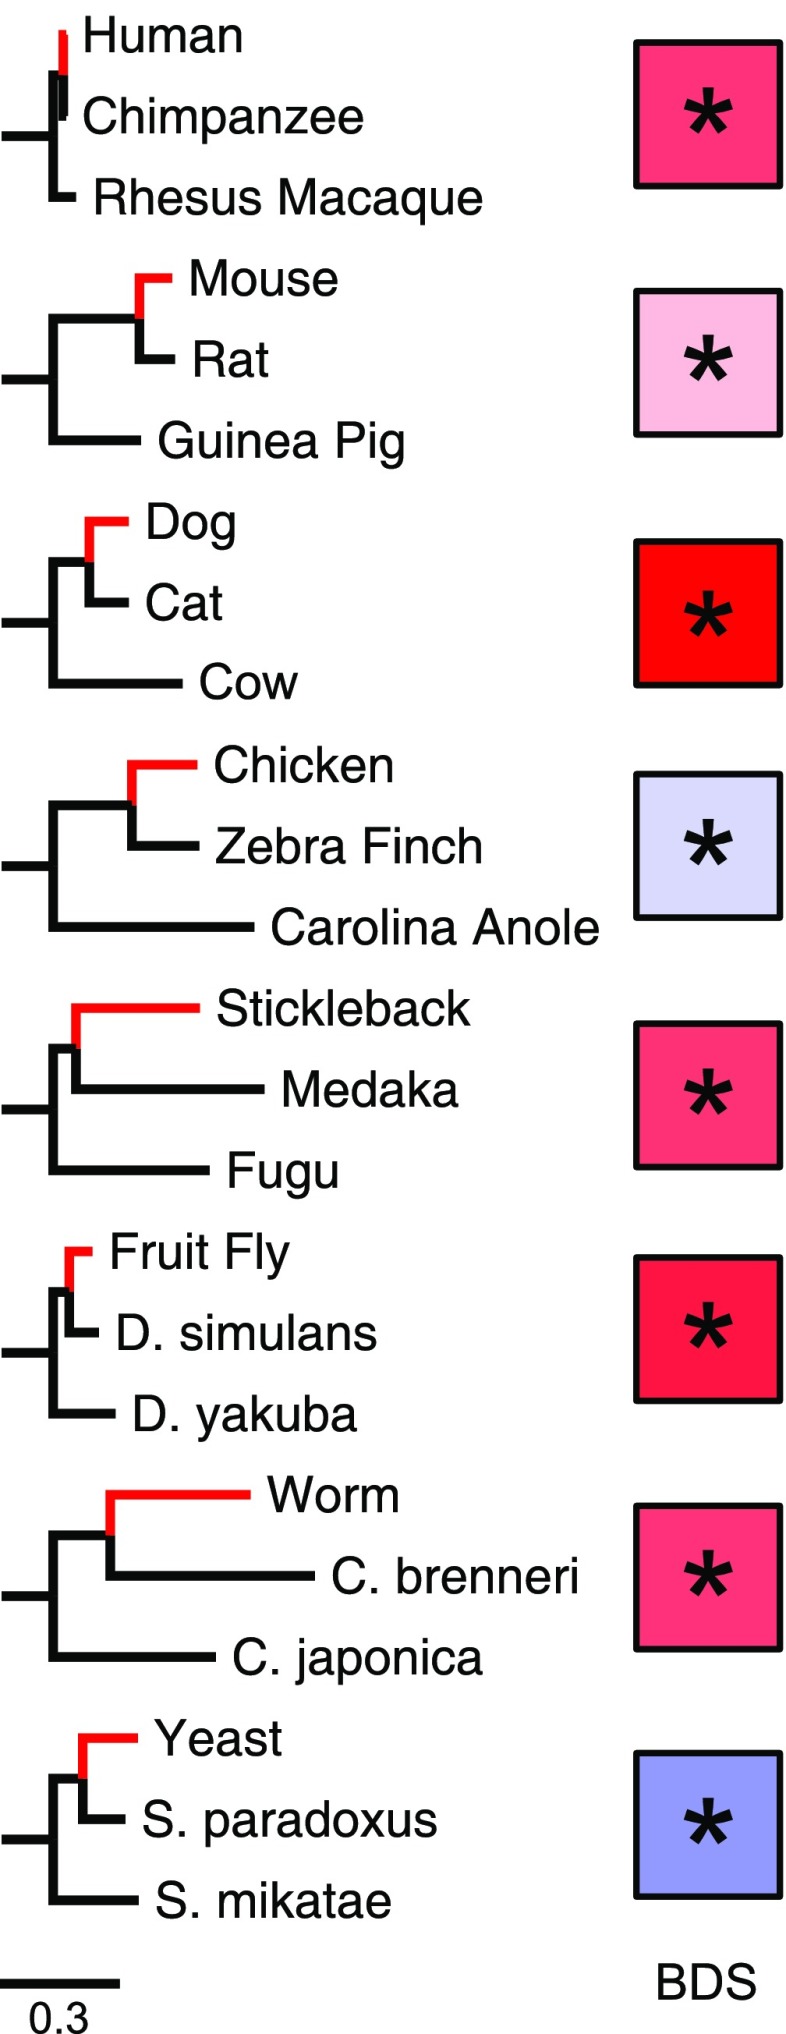
FIG. 1.—
The patterns of BDS across eight eukaryotic lineages. Each trio of species contains a reference (red branch), comparison, and outgroup species. Substitutions occurring on the branch leading to the reference species from the last common ancestor with the comparison species were considered. The color of each box reflects the strength of the BDS in the associated species. Warm colors (reds) indicate W→S BDS, and cool colors (blues) indicate a preference against W→S substitutions in fast-evolving regions. Asterisks indicate a significant deviation from expected substitution patterns. BDS statistics for each species are given in table 1.

