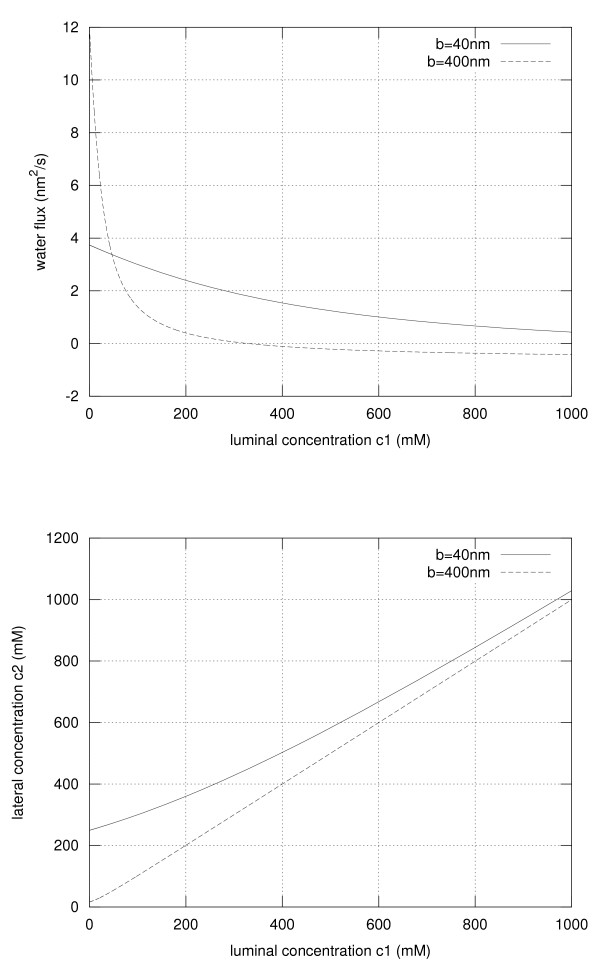
Figure 2.
Water flux and electrolyte concentration in the lateral intercellular cleft. The water flux through the TJ and thus through the lateral intercellular cleft (upper panel) and the electrolyte concentration c2 (lower panel) are depicted in dependence on the luminal electrolyte concentration c1. The results are shown for LI-cadherin binding, i.e. a narrow intercellular cleft (solid line) and for inactive LI-cadherin, i.e. a wide intercellular cleft (dashed line).

