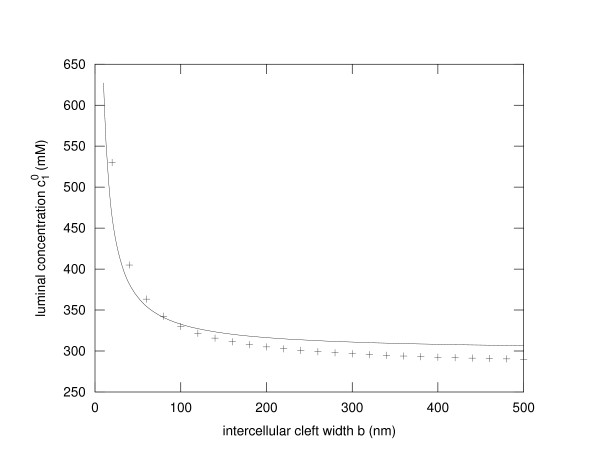
Figure 3.
Critical luminal electrolyte concentration. The critical electrolyte concentration  , i.e. the luminal electrolyte concentration at which the water flux through the tight junction changes sign is depicted in dependence on the width of the lateral intercellular cleft b. The solid line represents the results of Eq. 9. As evident from this equation a 1/b dependence of
  can be observed. The + - signs show the results from a full numerical simulation of a finite volume model taking various additional effects into account (see additional file 1). Clearly the principal dependency is highly similar.

