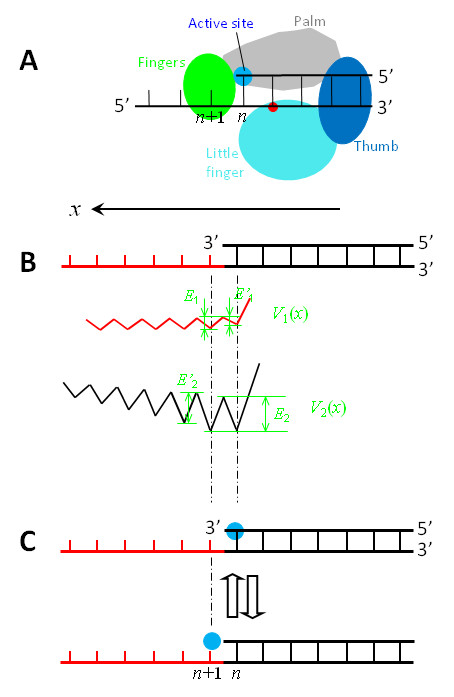
Figure 4.

Interaction potentials between a Y-family DNA Pol such as Dbh, in which the active site is, along the x direction, distanced away from (or not close to) the nearest residue of the binding site S2 located in the LF domain, and a DNA substrate shown in top of (b). (a) Schematic diagram of the Pol complexed with the DNA substrate. (b) V1(x) represents the potential of the binding site S1 interacting with the ssDNA segment, while V2(x) represents the potential of the binding site S2 interacting with the dsDNA segment. (c) Schematic diagrams of the position of the Pol along the DNA substrate, with blue dots representing the active site.
