
Figure 7.
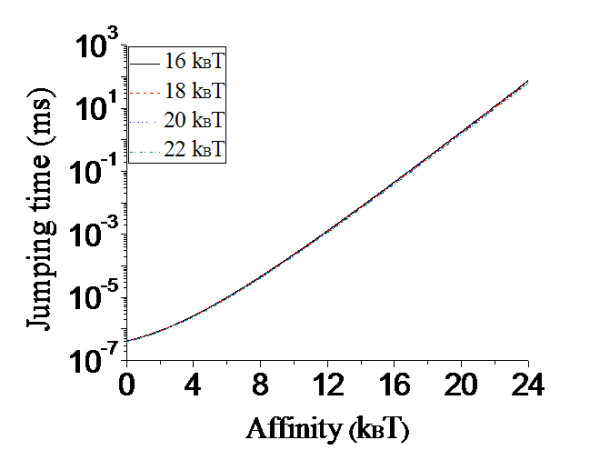
Results of the mean time Tn→(n+1) (T(n+1)→n) for the Y-family Pol to move from the nth ((n+1)th) site to the (n+1)th (nth) site versus En (En+1) for different values of En+1 (En) (indicated in the figure) before dNTP binding to the active site. Note that the four curves of Tn→(n+1) (T(n+1)→n) versus En (En+1) for different values of En+1 (En) are nearly coincident.