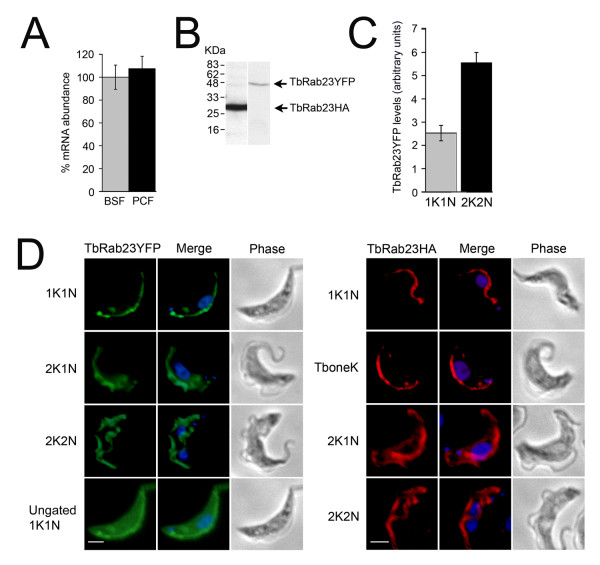
Figure 2.
TbRab23 localizes to the trypanosome flagellum and cell body in BSF cells. (A) TbRab23 mRNA is expressed to equivalent levels in BSF and PCF. Three separate RNA extractions were performed on WT BSF and PCF cells and were subjected to qRT-PCR. The data were normalized for RNA input to β-tubulin and expression of TbRab23 mRNA in PCF calibrated against expression in BSF (100%). The errors bars are the standard deviation over the three biological replicates. (B) Production of an in-frame tagged polypeptide of the correct molecular weight was verified by Western blot on BSF expressing either TbRab23YFP or TbRab23HA. (C) Histogram detailing expression levels of TbRab23YFP in 1K1K and 2K2N cells by immunofluorescence on unprocessed images. TbRab23YFP levels were quantified using Metamorph software and plotted graphically. The error bars denote the s.e.m (n = 20). Grey bar represents G1 (1K1N) cells and black bar mitotic (2K2N) cells. (D) Gallery of IFA images showing expression of recombinant TbRab23 fused to an N-terminal YFP (left panel) or HA-tag (right panel) in BSF cells. Cells were labelled with either anti-GFP or anti-HA and counterstained with Alexa-Oregon Green or Alexa-568 and 4', 6-diamidino-2-phenlindole (DAPI, blue) for visualization of the nucleus and kinetoplast. 1K1N signifies cells in G1 phase and 2K1N, the start of nuclear S phase. Note the kinetoplast replicates before the nucleus (2K2N). TbRab23 chimeras locate to the cell body, an extended structure that runs along the length of the cell, and to a punctate structure that is always found in close association with the kinetoplast. During the course of cell division the TbRab23 punctum is seen to replicate prior to kinetoplast replication. Subsequently, in 2K2N cells, a new elongated structure positive for TbRab23 is seen to emerge, which is fully formed prior to the onset of cytokinesis. YFP stain was observed to become more diffuse during S phase. TbRab23HA locates to the same structures as TbRab23YFP. An additional category, TboneK, denotes the point at which a kinetoplast has replicated but has not undergone separation. All images were captured at the same exposure. For clarity, some of the images were gated to remove the cell body signal. An ungated 1K1N cell is shown for comparison. Scale bar 2 μm.

