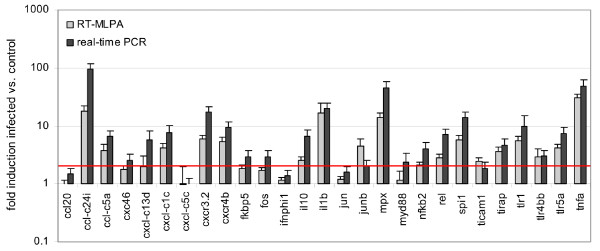
Figure 3.
Comparison of RT-MLPA and real-time PCR data. An RNA sample from an adult zebrafish infected with M. marinum strain Mma20 at 6 dpi was compared to a sample from a PBS-injected control fish from the same experiment [14]. Real-time PCR assays were performed in duplicate and RT-MLPA runs were repeated four times. Data are plotted on a logarithmic scale. The red line is set at a 2-fold induction level. Error bars indicate the standard deviation.

