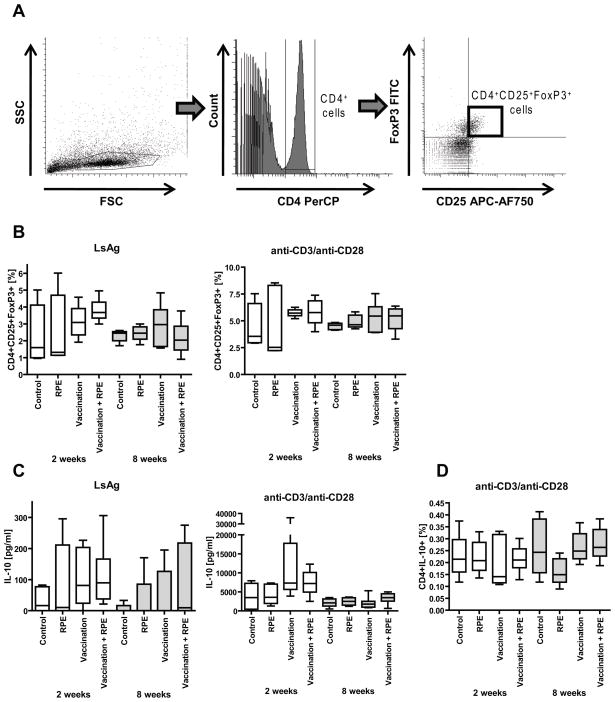
Fig. 5.
(A) Gating strategy for identification of CD4+CD25+FoxP3+ regulatory T-cells by flow cytometry. Lymphocytes were gated by forward (FSC) and sidescatter (SSC) characteristics (left panel). CD4 PerCP positive lymphocytes were then gated (middle panel) and analyzed for CD25 APC-AF750 and FoxP3 FITC positivity (right panel).
(B) Percentages of splenic CD4+ cells that are CD4+CD25+FoxP3+ after in vitro stimulation of splenocytes with parasite antigen (LsAg) or anti-CD3/anti-CD28. (C) IL-10 cytokine release from spleen cell culture supernatants in response to LsAg or anti-CD3/anti-CD28. (D) Percentages of splenic CD4+ cells that are CD4+IL-10+ in response to anti-CD3/anti-CD28. Shown are cells from mice that were vaccinated with L. sigmodontis L3s (Vaccination) and/or given repeated parasite exposures (RPE) with irradiated larvae for two (open bars) or eight weeks (grey bars). Control groups were vaccinated with media and then given repeated media injections. Significant differences between groups were analyzed by the Kruskal-Wallis test, followed by Dunn’s post-hoc multiple comparisons (*p<0.05). Timepoints listed are duration of RPEs. Shown are results from two independent experiments (2 week timepoint: RPE n=5, Vaccination n=8, Vaccination + RPE n=8; 8 week timepoint: RPE n=4, Vaccination n=7, Vaccination + RPE n=8).

