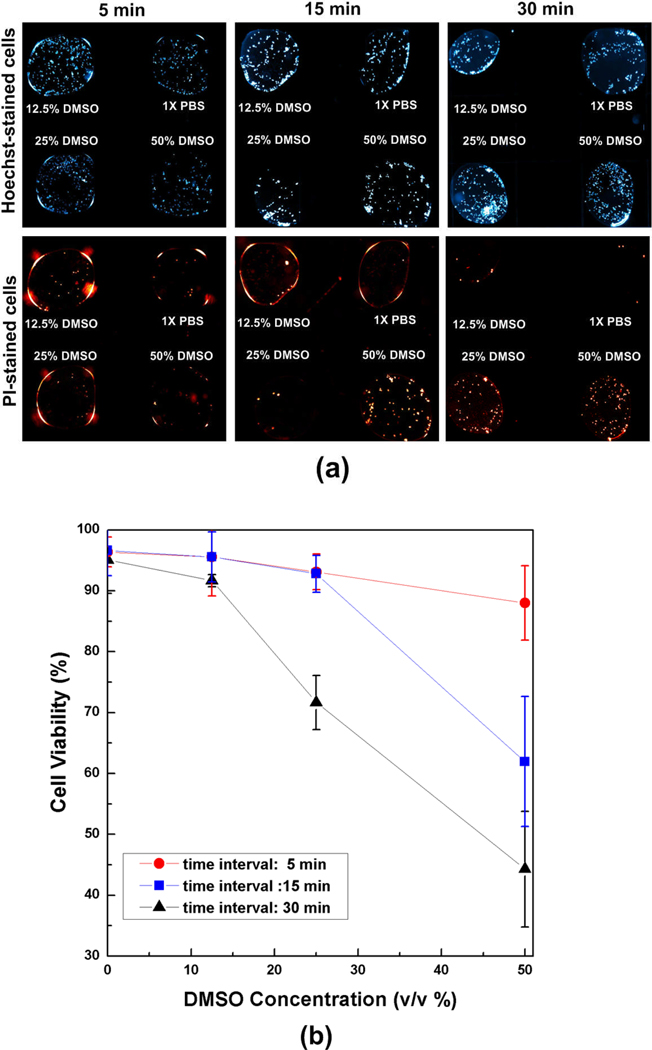
Figure 5.
Toxicity screening of DMSO-PBS mixtures. (a) Fluorescence micrographs of cell suspension droplets exposed to DMSO-PBS mixtures. After the exposure, the droplets were mixed with viability dye droplets to stain all cells with Hoechst and injured cells with PI. (b) Cell viability with respect to DMSO concentrations (v/v %) and exposure time (n ≥ 3 for each point). The viability decreases with the DMSO concentration and the exposure time.

