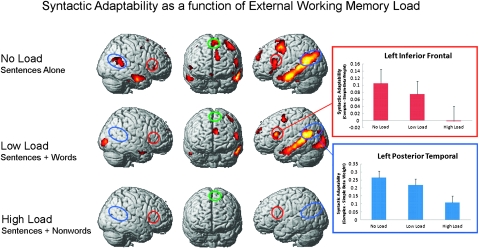
Figure 4.
Activation maps show regions of increased activation for complex versus simple syntax in each of the 3 working memory load conditions. Inferior frontal regions (including Broca’s area and its RH homologue) are circled in red, superior posterior temporal regions (including Wernicke’s area and its RH homologue) are circled in blue, and the medial frontal region is circled in green. The bar graphs depict mean signal change (syntactically complex—simple sentence beta weights) averaged across LH inferior frontal (red) and posterior temporal (blue) ROIs in each of the 3 working memory load conditions (error bars show standard error of the mean).

