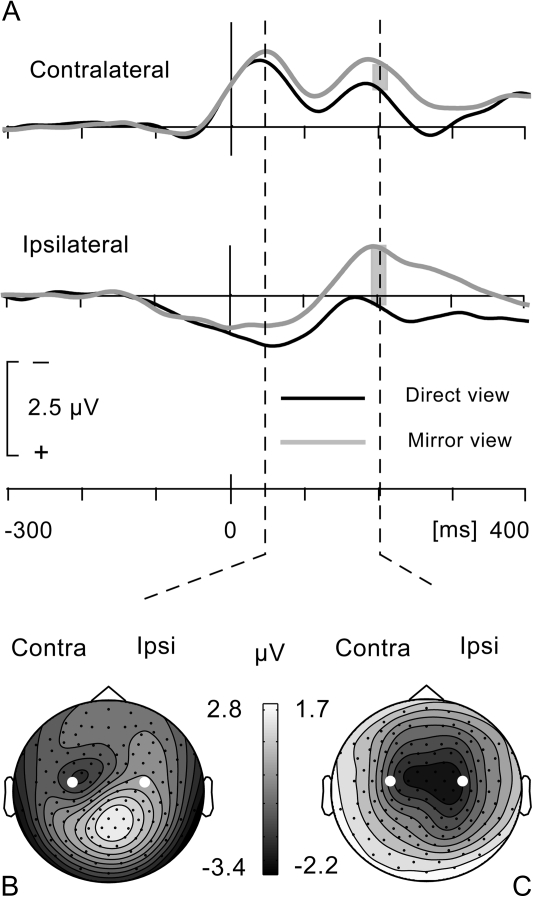
Figure 5.
(A) Data averaged across right and left hand movements, after left–right transposition of the data for the left hand condition. Contralateral waveforms show 2 phases corresponding to motor cortex activation for index finger extension and flexion, respectively. At the peak of the first phase, focal activation of the motor cortex can be distinguished in the scalp voltage distribution, shown for the mirror view condition (B). Contralateral and ipsilateral waveforms show higher amplitude movement-related activity for the mirror view condition. Subtracting mirror view and direct view conditions reveals the excess activity in the mirror view condition to be maximal over the ipsilateral hemisphere (C), indicating mirror-induced activation of ipsilateral motor cortex. Time 0 is where the EMG signal crossed the defined amplitude threshold. Electrodes marked in white are C3 (contralateral) and C4 (ipsilateral).

