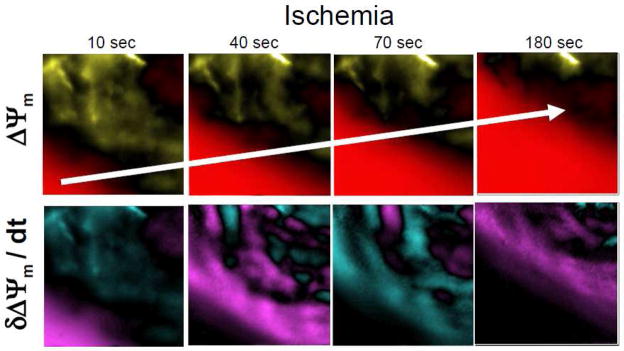
Figure 2. Spatio-temporal fluctuations of Δψm during global ischemia (Adapted from Figure 4, Lyon et al. J Mol Cell Cardiol. 2010, PMID: 20624394).
Successive contour maps of normalized Δψm (above) and its first derivative (below) acquired at 10, 40, 70, and 180 seconds following the onset of global no-flow ischemia in a representative rat heart. These data illustrate the presence of spatially and temporally discordant kinetics of Δψm that exist ahead of the main depolarization wave of Δψm collapse, which actively propagates across the heart. Color scale: a) Δψm contour maps: baseline (black), depolarization (red), hyperpolarization (yellow); b) δΔψm/δt contour maps: baseline (black), positive slopes (turquoise), negative slopes (purple).

