FIGURE 1.
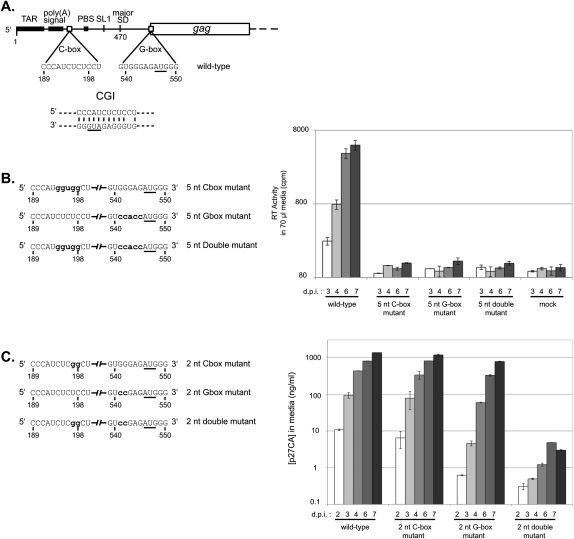
Compensatory mutation analysis of the CGI. (A) Schematic of HIV-2 genomic RNA. (TAR) Trans-activation region; (poly(A) signal) poly(A) signal domain; (C-box) the core of the C-box; (PBS) the tRNA primer binding site; (SL1) the stem–loop one dimerization signal; (major SD) the major splice donor site; (G-box) the core of the G-box; and (gag) the Gag protein-coding region. A proposed C-box/G-box interaction (CGI) is illustrated below. The AUG initiation codon of Gag, found in the G-box, is underlined. (B, left panel) Schematic of the 5-nt mutation series. Only the C-box and G-box regions of the unspliced genomic RNAs are represented. Nucleotide positions that are mutated are in bold lowercase letters. (Right panel) Replication kinetics of the wild-type, the 5-nt C-box mutant, the 5-nt G-box mutant, and the 5-nt double mutant viruses in C8166 cells. Equal amounts of viral particles (10 ng of p27 capsid, as determined by ELISA) produced during COS-7 transfection were used to infect C8166 cells. Viral replication was measured using reverse transcriptase quantification. Numbers below the x-axis represent days post-infection. The y-axis error bars represent the standard error of duplicate experiments. (C, left panel) Schematic of the 2-nt mutation series. Only the C-box and G-box regions of the unspliced genomic RNAs are represented. Nucleotide positions that are mutated are in bold lowercase letters. (Right panel) Replication kinetics of wild-type, the 2-nt C-box mutant, the 2-nt G-box mutant, and the 2-nt double mutant viruses in C8166 cells. Equal amounts of viral particles (10 ng of p27 capsid, as determined by ELISA) produced during COS-7 transfection were used to infect C8166 cells. Viral replication was measured using p27 capsid quantification. Numbers below the x-axis represent days post-infection. The y-axis error bars represent the standard error of duplicate experiments.

