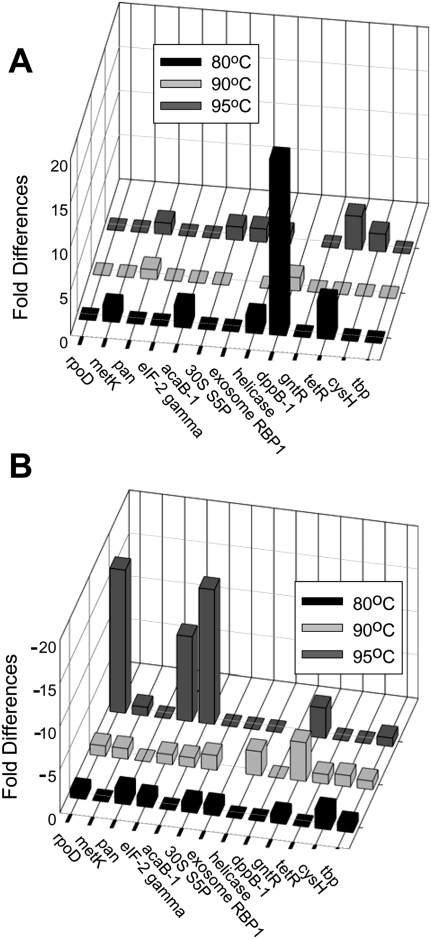
FIGURE 7.
Transcriptomic effects of VapBC6 deficiency. Relative transcript abundance of genes were determined by qRT–PCR in total RNA samples from the vapB6 disruption mutant and wild-type strain. (A) Transcripts whose abundance increased in the vapB6::lacS mutant relative to the wild type during heat shock. (B) Transcripts whose abundance decreased in the vapB6::lacS mutant relative to the wild type during heat shock. RNA levels were determined from cells growing exponentially at 80°C (filled bars), or 5 min after temperatures of the cultures reached 90°C (light gray bars), or 95°C (dark gray bars).

