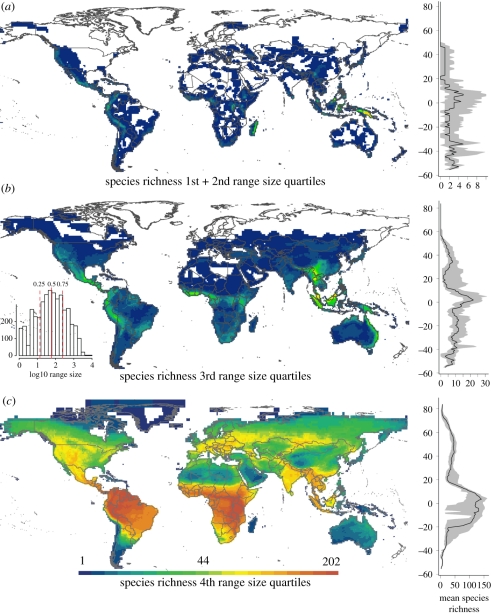
Figure 1.
The distribution of mammalian species richness for (a) narrow-ranged species in the bottom half of the range-size distribution (inset); (b) species in the third quartile of the range-size distribution; and (c) species in the upper quartile of the range-size distribution. A latitudinal gradient in mean richness (black) is presented to the right of each map, with the interquartile range of richness given by the grey polygon.

