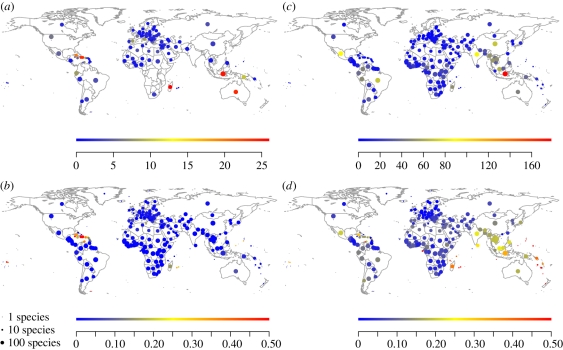
Figure 1.
Global patterns of Holocene species extinctions and currently threatened species. (a) Number and (b) proportion of extinct species; (c) number and (d) proportion of threatened species. Countries without extinct or threatened species in our dataset are not plotted in (a) and (c). Plots in (b) and (d) use the same colour scale; proportions above 0.5 were set to 0.5. The size of the plotted circles reflects the total number of species (extant + extinct) in (a) and (b), and the number of extant species in (c) and (d), on a logarithmic scale (see size key).

