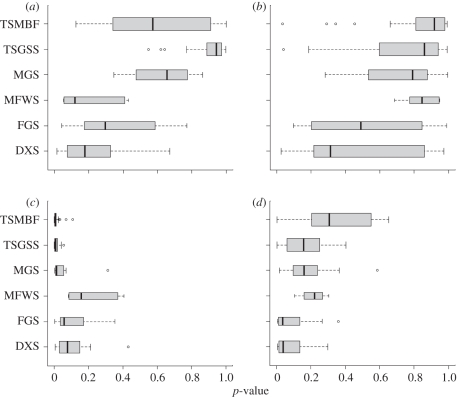
Figure 2.
Box and whisker plots showing the distributions of p-values (on the x-axis) for phylogenetic structure metrics ((a,c) NRI and (b,d) NTI) among ecoregions. Null models are constructed from (a,b) biome and (c,d) continental source pools. p-values at the left extreme of the distributions (p < 0.025) indicate phylogenetic clustering; p-values at the right extreme of the distributions (p > 0.975) indicate phylogenetic overdispersion. Ecoregions are grouped into biomes, as follows: TSMBF, tropical and subtropical moist broadleaf forests; TSGSS, tropical and subtropical grasslands, savannahs and shrublands; MGS, montane grasslands and shrublands; MFWS, Mediterranean forests, woodlands and scrub; FGS, flooded grasslands and savannahs; DXS, deserts and xeric shrublands. Width of the boxes is proportional to the number of ecoregions in each biome.

