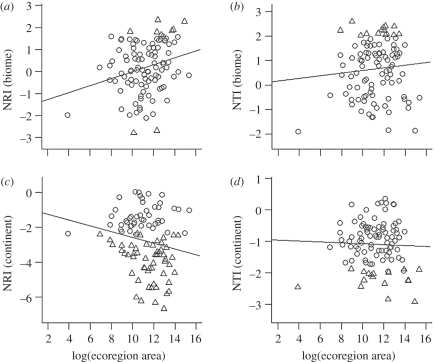
Figure 3.
Associations between ecoregion area and phylogenetic structure ((a,c) NRI and (b,d) NTI) of ecoregion carnivore assemblages, using null models constructed from (a,b) biome and (c,d) continental source pools. Open circles represent ecoregions in which assemblage structure is consistent with the null model; triangles represent ecoregions in which assemblages are significantly overdispersed (positive NRI or NTI value) or significantly clustered (negative NRI or NTI value).

