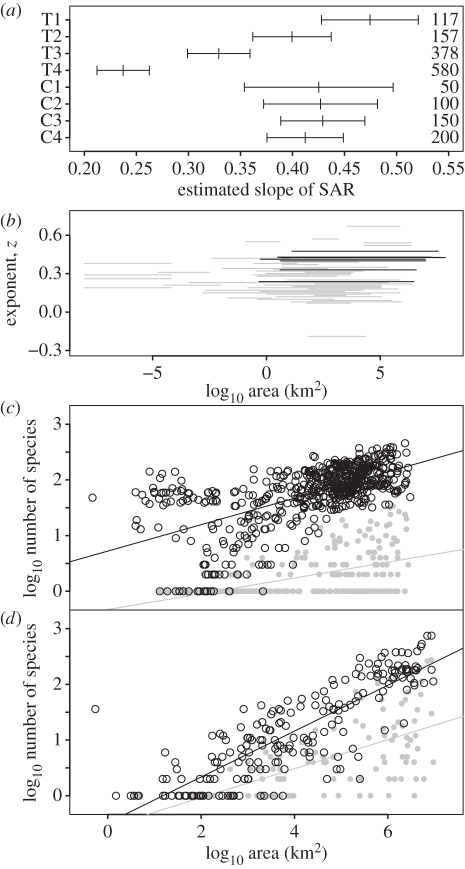
Figure 3.
(a) Slopes and their standard errors of SARs for 4560 terrestrial mammals at four different scales across geopolitical regions (T1–4) and biotic regions (C1–4). (b) Distribution of power-law exponents from mammalian SARs showing the range of non-nested region sizes considered (grey lines—data from [37]; black lines—values from panel above). Scatterplots show the distribution and least-squares fit of SARs for (c) T4 and (d) C4 for total (black) and endemic species richness (grey). See also electronic supplementary material, table S1, figures S3 and S4.

