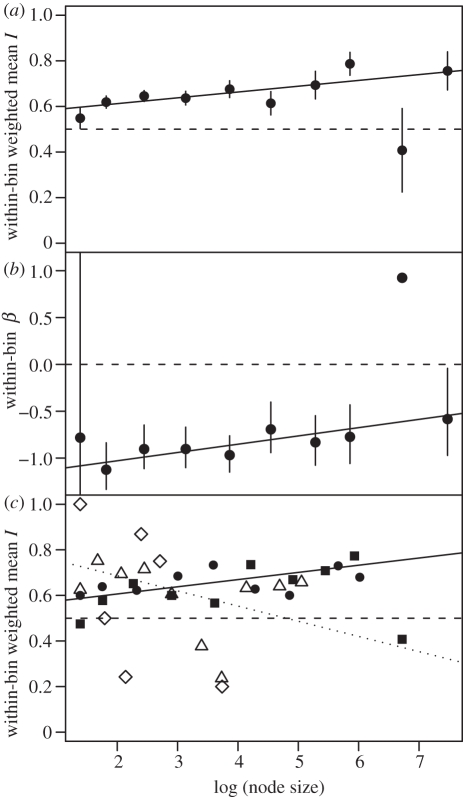
Figure 1.
(a) Iw signature for the whole mammalian phylogeny. Points are within-bin Iw; vertical lines indicate ± 1 s.e. (Note the large s.e. of the second point from the right, associated with a small sample size.) Horizontal dashed line, ERM expectation. Solid line is weighted regression, with sample sizes as the weights: slope = 0.025, t8 = 2.573, p = 0.03. (b) β signature for the whole tree. Points are within-bin estimates of β; vertical lines are confidence intervals under a χ2 approximation. (The second point from the right is again unusual but uncertain.) Horizontal dashed line, ERM expectation. Solid line is weighted regression, with the inverse of the confidence interval width as weights: slope = 0.088, t8 = 2.238, p = 0.06. (c) Iw signature for each of four superorders. Points are within-bin mean Iw. Triangles, Marsupialia; diamonds, Afrotheria; squares, Laurasiatheria; circles, Euarchontoglires. Dotted line is regression through Marsupialia and Afrotheria (slope = −0.067, t14 = −1.768, p = 0.1); solid line is regression through Laurasiatheria and Euarchontoglires (slope = 0.032, t17 = 2.685, p = 0.02); regressions weighted as in (a).

