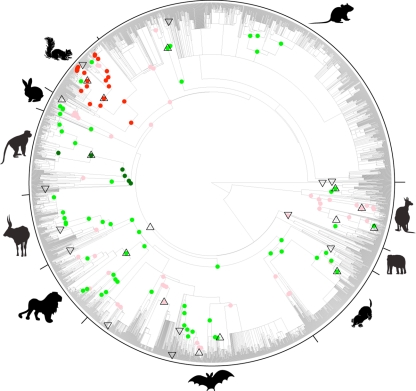
Figure 2.
Diversification rate shifts localized on the supertree. Major clades are summarized with pictograms (clockwise from top: Rodentia, ‘Marsupials’, ‘Afrotheria’, ‘Eulipotyphyla’, Chiroptera, Carnivora, Cetartiodactyla, Primates, Lagomorpha, Sciuridae). Filled circles indicate subtrees with betas different from that of the whole tree (see text for details). More unbalanced: red (non-overlapping CI) and pink (maximum-likelihood estimate of β for subtree outside whole-tree CI); more balanced: green (non-overlapping CI) and light green (ML estimate of β for subtree outside whole-tree CI). Triangles indicate nodes with significant (p ≤ 0.05) upshifts as indicated by Δ1 (upwards pointing) and putative downshifts (downwards pointing).

