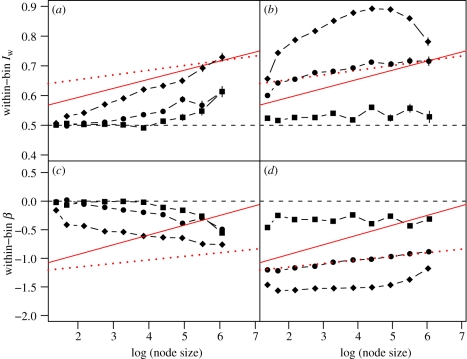
Figure 4.
Iw and β signatures for six simulation models, which are described fully in the text. (a,c) Instantaneous speciation rate depends linearly on the values of an evolving trait (squares, binary trait; circles, gradually evolving trait; diamonds, punctuational trait). (b,d) Models in which close relatives often have very different speciation rates. Squares, rates depend on a fast-evolving binary trait; circles, rates decline exponentially with time since speciation; diamonds, spatial model; dashed line, ERM expectation. Best-fit lines for vertebrate data (solid lines) and non-vertebrate data (dotted lines) are provided for comparison.

