Figure 3.
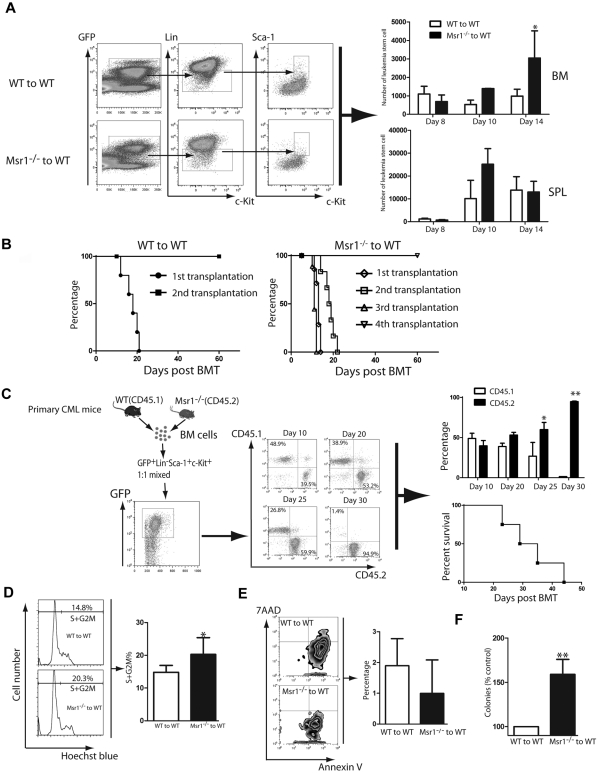
Msr1 deletion affects the function of LSCs. (A) Loss of Msr1 caused a significant increase in LSCs in bone marrow (*P < .05). Mean value (± SD) for each group is shown (*P < .05). (B) Kaplan-Meier survival curves for a serial transplantation of recipients of 1 × 10⁶ bone marrow cells from mice receiving BCR-ABL–transduced WT (n = 5) or Msr1−/− (n = 5) donor bone marrow cells. (C) Bone marrow cells derived from CML mice induced by transplanting BCR-ABL–transduced WT (CD45.1) or Msr1−/− (CD45.2) donor bone marrow cells were isolated. 5 × 10³ WT and Msr1−/− LSCs were sorted by FACS, mixed by 1:1 ratio, and transplanted into lethally irradiated secondary recipient mice. At days 10, 20, 25 and 30 after BMT, FACS analysis showed that the percentages of CD45.2+ cells were much higher than those of CD45.1+ cells. All these mice died of CML, presumably because of the development of CML from CD45.1+ cells. (D) At 14 days post transplantation, bone marrow cells were isolated from recipients of BCR-ABL–transduced bone marrow cells from WT or Msr1−/− donor mice. The cells were stained with Hoechst Blue, and the DNA content, represented by the percentages of LSC populations in the S+G2M phase of the cell cycle, was examined by FACS. Mean percentage for each cell population (n = 4) is shown (*P < .05). (E) At 14 days post transplantation, bone marrow cells were isolated from recipients of BCR-ABL–transduced bone marrow cells from WT or Msr1−/− donor mice. The cells were stained with 7AAD and annexin V, and the percentages of LSCs positive for 7AAD and annexin V, representing apoptotic cells, were determined by FACS. (F) LTC-IC assay was performed to compare the function of LSCs. GFP+ bone marrow cells were sorted from recipients of BCR-ABL–transduced from WT or Msr1−/− donor bone marrow cells. The cells were cultured for 5 weeks in the presence of stromal cells. Colony formation was assessed 2 weeks later.

