Fig. 5.
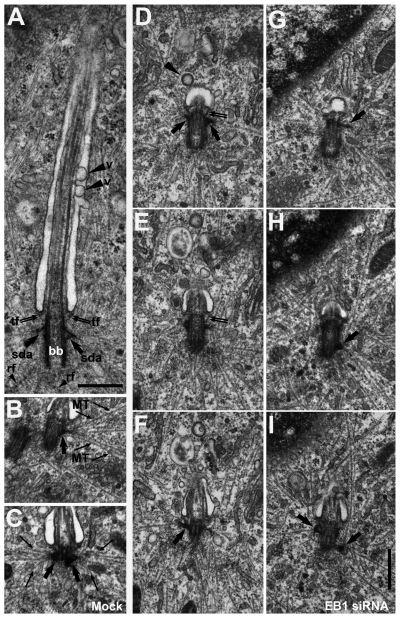
Ultrastructural analysis of hFF cells treated with mock or EB1-specific siRNA. TEM analysis of growth-arrested control (mock; A–C) or EB1-depleted (D–I) hFF cells. (A) Longitudinal section of a basal body (bb) and attached primary cilium. Transition fibers (tf; thin double arrows), subdistal appendages (sda; thick arrows) and rootlet filaments (rf; small arrowheads) are visible. In the cilium pit two vesicles (v; large arrowheads) are present. (B,C) Grazing longitudinal sections of basal bodies. Microtubules (MT; thin arrows) radiating in a fan-like pattern from the subdistal appendages (thick arrows) are seen. (D,F) Consecutive longitudinal serial sections of a basal body bearing a stumpy cilium. Subdistal appendages (D–F; thick arrows) and transition fibers (D,E; thin double arrows) can be seen. In D, a coated vesicle constricting from the cilium-pit is visible (large arrowhead). (G–I) Consecutive longitudinal serial sections of a basal body with attached stumpy cilium. Three subdistal appendages can be seen, one of which is attached to the centriole in a more median to proximal position (H,I; thick arrows at the right side of the centriole) than the other two (G,I; thick arrows). Scale bars: A, 500 nm; I, 500 nm (applies to B–I).

