Fig. 7.
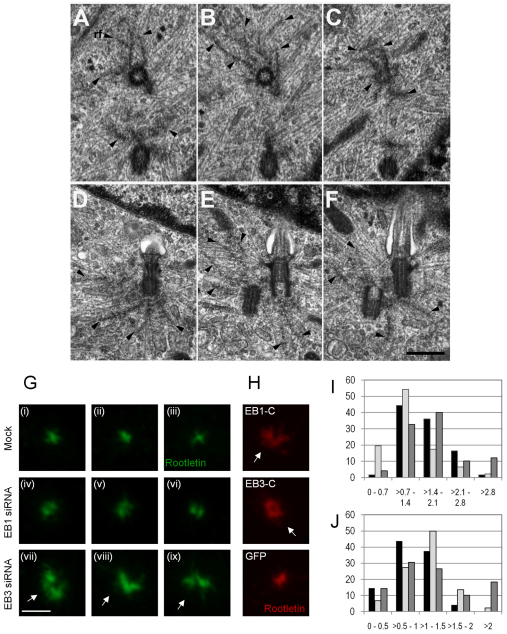
Cells lacking EB3 contain abnormally long rootlet filaments. (A–F) TEM analysis of growth-arrested, EB3-depleted hFFs. (A–C) Consecutive serial cross sections of a centriole displaying an elaborate and extended rootlet filament (rf) system (small arrowheads). The second centriole is sectioned in an oblique angle. (D–F) Consecutive longitudinal serial sections of both centrioles with the basal body bearing a stumpy cilium. Both centrioles display an elaborate system of rootlet filaments (small arrowheads) attached to their proximal end. Scale bar: 500 nm. (G) IFM of siRNA-treated, serum-starved hFFs stained with anti-rootletin antibody (Bahe et al., 2005). Abnormally long rootlets are seen in EB3-depleted cells (arrows in vii-ix). (H) Different RPE cell lines (see Fig. 2) analyzed by IFM with rootletin antibody. Unfocused rootletin staining (arrows) is seen in cell lines expressing GFP-EB1-C or GFP-EB3-C. Similar dispersal of phosphorylated β-catenin staining was observed in the same cell lines (data not shown). Scale bar: 3 μm (applies to G and H). (I,J) Quantification of the results shown in G and H, respectively. The x-axis depicts area of rootletin staining in μm2, whereas the y-axis indicates percent of cells (44–61 cells analyzed per sample). In I, mock-, EB1 siRNA- and EB3 siRNA-treated cells are represented by black, light gray and dark gray columns, respectively. In J, GFP-, GFP-EB1-C and GFP-EB3-C expressing cells are represented by black, light gray and dark gray columns, respectively. Note that depletion of EB3 (I) or expression of GFP-EB1-C or GFP-EB3-C (J) causes an increase in the area of rootletin staining in many cells.

