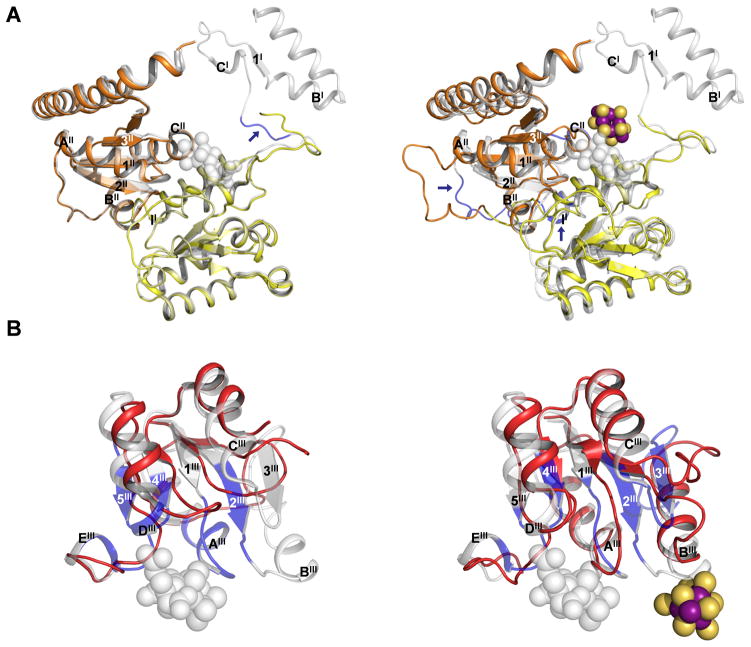
Fig. 2.
(A) Superposition of αI- and αII-domains of apo NifDK and NifDK (left) and those of NifEN and NifDK (right). The domains of apo NifDK and NifEN are color coded as in Fig. 1. NifDK is shown in gray (transparent). Regions with significant shifts in Cα-positions are colored blue and indicated by arrows, and the secondary structural elements of these regions are labeled according to those in Fig. S4A. The L-cluster is illustrated as in Fig. 1. The M-cluster is shown as a space-filling model in gray (transparent). PYMOL was used to prepare the figure (18). (B) Superposition of the αIII-domains of apo NifDK and NifDK (left) and those of NifEN and NifDK (right). Apo NifDK and NifEN are colored red; whereas NifDK is shown in gray (transparent). Regions with significant shifts in Cα-positions are colored blue. The secondary structural elements are labeled according to those shown in Fig. S4A. The L-cluster is illustrated as in Fig. 1. The M-cluster is shown as a space-filling model in gray (transparent). PYMOL was used to prepare the figure (19).

