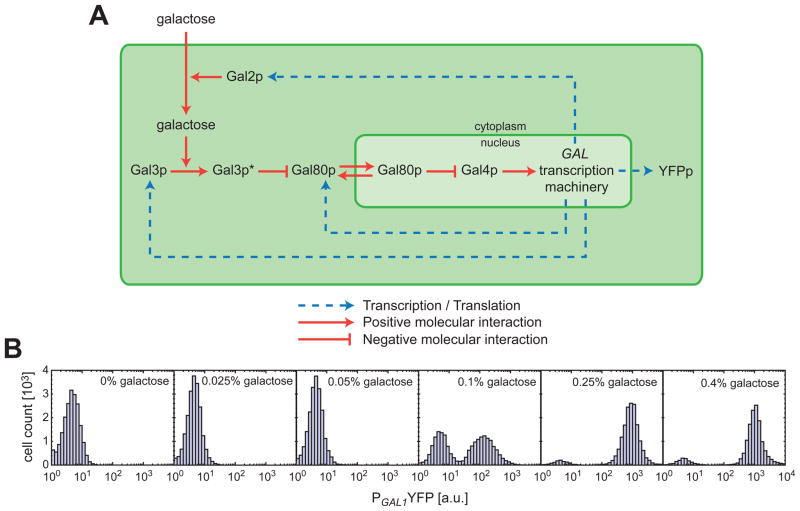
Fig. 1. The galactose utilization pathway as a model gene network and bistability as a quantitative phenotype.
(A) Gal3p* represents the galactose-bound, active form of Gal3p. The shuttling of Gal80p between the cytoplasm and the nucleus is denoted by the bidirectional red arrows. The dotted blue arrows show how the transcriptional feedback loops are established through Gal2p, Gal3p, and Gal80p. (B) Histograms show the induction profile of the wild type galactose pathway for different galactose concentrations.

