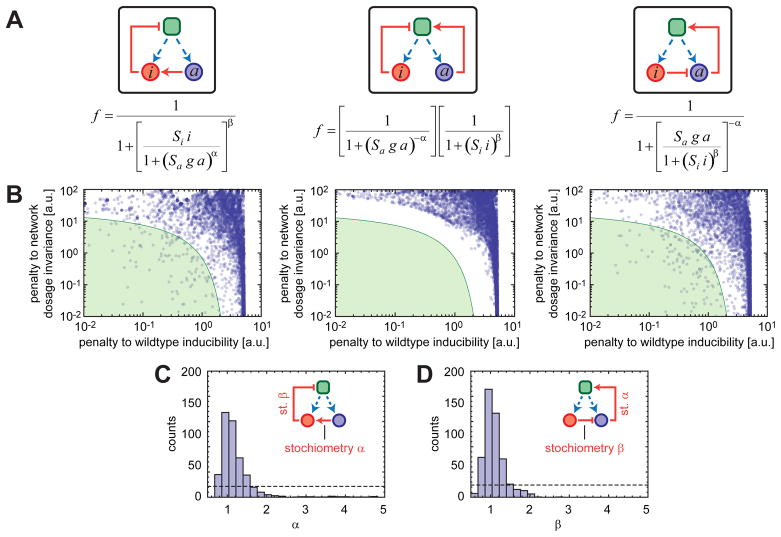
Fig. 4. Numerical analysis of general network features producing an inducible and network-dosage invariant system.
(A) Each functional form represents the relationship between the fraction of transcriptionally active cells and the total concentrations of the activating (a) and inhibiting (i) agents. Blue and red circles represent activating and inhibiting agents, respectively. Dashed blue arrows denote the transcriptional production of the network components. The green square represents a transcriptional center. Pointing red arrows show direct activation while blunt red arrows represent inhibition. Each configuration is described by 4 parameters: the scales of action of the activator and inhibitor (Sa and Si respectively) and coefficients (α and β) quantifying the typical nonlinearity of the interaction with downstream components. (B) For each configuration depicted in (A), the degree of inducibility and network-dosage invariance of systems are plotted on the x and y axes, respectively. The green region corresponds to systems that are both inducible and network-dosage invariant. (C) For the left configuration in (A), histogram of the parameter values corresponding to the green region shown in (B). (D) As in (C) but for the right configuration shown in (A). In (C–D), the dotted lines show what one would expect had the parameters had no effect in determining whether the system was in the green region or not.

