Figure 3.
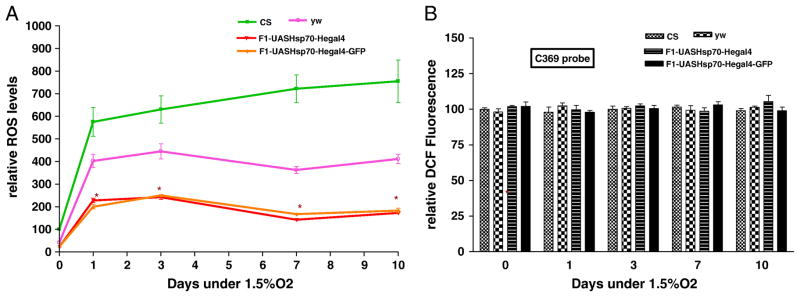
Figure 3a – Relative ROS levels after 1.5% O2. Up regulation of Hsp70 in hemocytes reduced the ROS levels significantly. Each point represents the average of at least three tests for each line and error bars represent the standard errors. * with unpaired t-test P<0.05 with controls vs. the genotype.
Figure 3b- Measurement of Fluorescence with oxidation-insensitive probe of DCFH (C369) as a control under 1.5% O2. Each bar represents the average of at least three tests for each line and error bars represent the standard errors.

