Figure 8.
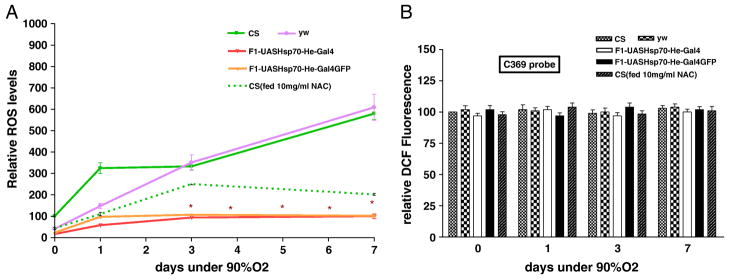
Figure 8a- Relative ROS levels after hyperoxia treatment. Upregulation of Hsp70 in hemocytes reduced the ROS levels significantly. Each point represents the average of at least three tests for each line and error bars represent the standard errors. * With unpaired t-test P<0.05 with controls vs. the genotype.
Figure 8b-Measurement of Fluorescence with oxidation-insensitive probe of DCFH (C369) as a control under 90% O2. . Each bar represents the average of at least three tests for each line and error bars represent the standard errors

