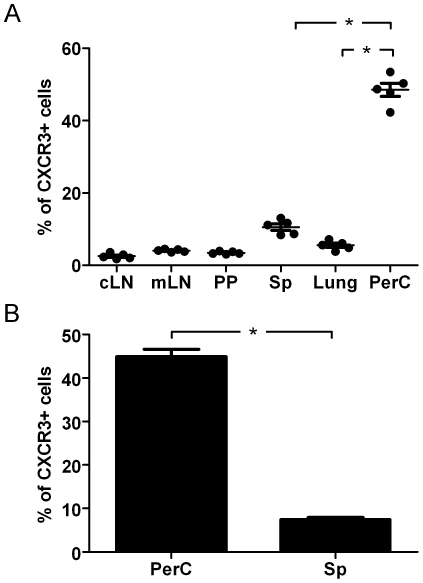
Figure 1. The percentage of CXCR3+ CD4+ T cells is higher in PerC than in other organs.
The percentage of CXCR3+ CD4+ T cells in different organs was determined by flow cytometry. (A) Cells isolated from naïve Balb/c animals were analyzed (n = 5). Each point represents an individual animal. (B) Cells isolated from 10 to 20 naïve Balb/c animals were pooled. Results from 8 independent experiments are presented. Error bars indicate SEM. cLN, cervical lymph node; mLN, mesenteric lymph node; PP, Peyer's patches; Sp, spleen; PerC, peritoneal cavity. (*) Statistically significant at P<0.05.

