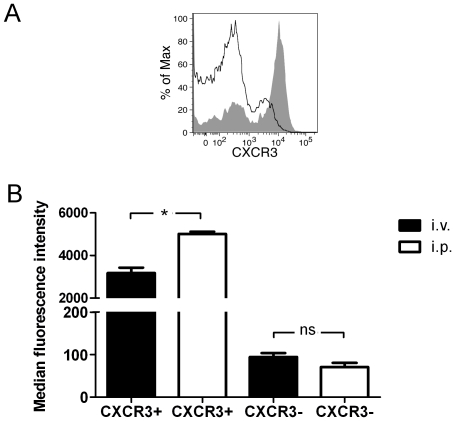
Figure 3. The PerC environment results in increased expression of CXCR3 on CD4+ T cells.
(A) The expression level of CXCR3 on CD4+ cells from spleen (black line) or PerC (grey area) of BALB/c mice was determined by flow cytometry. (B) CXCR3+ and CXCR3− CD4+ T cells were sorted from Sp of donor BALB/c mice and stained with CFSE. Cells were then adoptively transferred to naïve recipient animals by i.v or i.p. route. After 24 h, cells were re-isolated from spleens or peritoneal cavities and re-stained with an anti-CXCR3 antibody. The expression level of CXCR3 on CFSE+ cells was then analyzed by flow cytometry. The differences were statistically significant at P<0.001 (*), n.s. – not significant.

